

Background
“There was a time when it was said that the Indian budget was a gamble on the monsoons. That is not the case anymore, with industrial production soaring and agriculture on the margins. But what is clear is that without addressing the problems of the majority of farmers in unirrigated land (where medium of irrigation is none except rain), we are not going to achieve food security.”1
“Rain-dependent areas can be broadly split into two: ‘dry lands’, which receive less than 750 mm (75cm) of rain a year; and rainfed areas, which receive more than 750 mm. (75cm). Comprising arid and semi-arid ecosystems, dry lands stretch from Gujarat in the west till Eastern Madhya Pradesh; and from Rajasthan till the southern tip of India.
India ranks first among the rainfed agricultural countries of the world in terms of both extent and value of produce. Due to population pressure on agricultural lands, the poverty is concentrated in rainfed regions. The climate in India’s rainfed regions is characterized by complex climatic deficiencies, manifested as water scarcity for rainfed crop production. The climate is largely semi-arid and dry sub-humid with a short (occasionally intense) wet season followed by long dry season. Rainfall is highly unreliable, both in time and space, with strong risks of dry spells at critical growth stages even during good rainfall years.”2
This link takes you to the average annual rainfall map of India. (fig 1)
https://www.mapsofindia.com/maps/india/annualrainfall.htm
There has been deficient rainfall over past few years and that has affected availability of water for agriculture. Figure 2 shows this data.
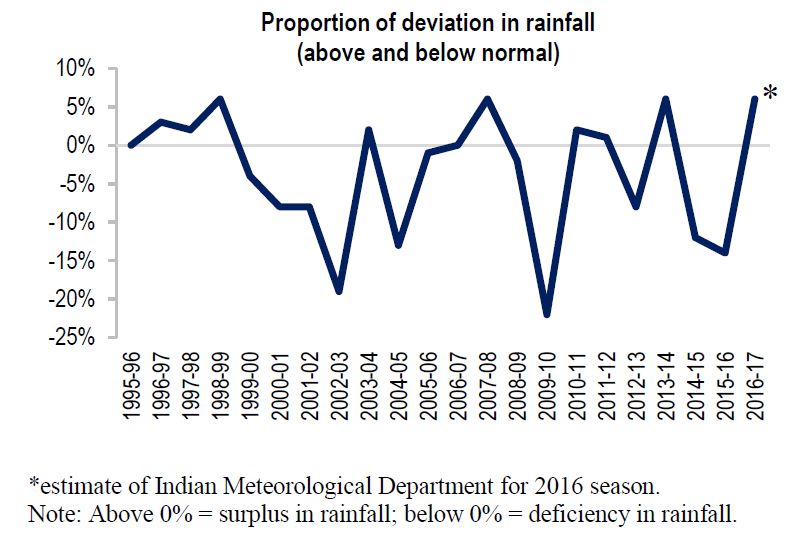
Figure 2
“Rainfall in the country (as compared to the average rainfall since 1951) has been volatile over the past 20 years. The lowest level of rainfall was in 2009-10, at 22% below normal, whereas the highest level of rainfall was in the years 2013-14, 2007-08 and 1998-99, at 6% above normal. This deviation in rainfall may not be uniform across the country. For example, in a year of overall excess rainfall, there may be regions which received deficient rainfall.”3
Present Scenarios
It is estimated that “more than half of agricultural sown land, i.e. 53% is dependent on rain-fed irrigation. 53% (73.83 million hectares) of the sown agricultural area (total sown area for 2012-13 was 139.93 million hectares) in the country is dependent on rain-fed irrigation as of 2012-13, which is the latest data available. Rain-fed irrigation is dependent on rain water and is not supplemented by water from any other source.
Rest 47% (66.1 million hectares) of the sown area is irrigated by ground water sources such as wells and tube-wells, and surface water sources such as canals and tanks, as of 2012-13 [Net irrigated area]. This area constituted 18% (20.9 million hectares) of the sown area in 1950-51.”4 See Figure 3.

Figure 3
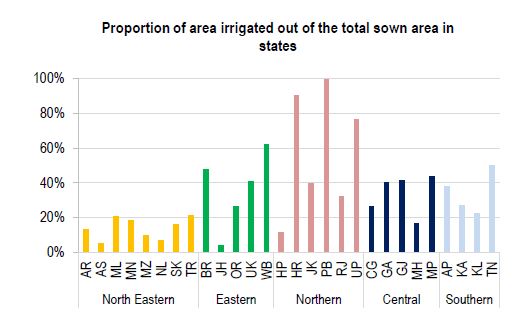
It is mostly the North Eastern states that depend on rainfall while Northern states depend on ground and surface water. “The northern states of Punjab (99.5%), Haryana (90%), and Uttar Pradesh (76%) have the highest proportion of sown area which is irrigated by ground water and surface water sources.
In contrast, less than 25% the sown area in the north-eastern states of Manipur, Meghalaya, Mizoram, and Nagaland is irrigated by ground and surface water sources. This implies that these states rely more on rain-fed irrigation.
The central states such as Maharashtra (17%) and Chhattisgarh (26%), and southern states such as Kerala (22%) and Karnataka (27%) also have lower proportions of sown area under irrigation.”5 See the figure 4 on page 36.
Conclusions on Status of Water Availability for Agriculture in India
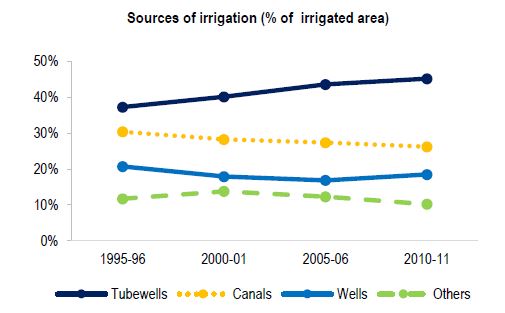
In the first part of the article on agriculture, we explored one of the major sources of irrigation in India, i.e., dams and canals. In this part we have seen the status of the next two major sources of irrigation, i.e., groundwater and rain. As we saw above 53% of the sown agricultural area in the country is dependent on rain-fed irrigation as of 2012-13 and the rest 47% is dependent on groundwater. On page 36 is the breakdown figure 5 of the “sources of irrigation.”6
For complete data on land use and irrigation pattern see table 1 in the Appendix (p.38).
References:
- http://www.downtoearth.org.in/coverage/india-must-focus-on-rainfed-farming-6259)
- https://www.gktoday.in/rainfed-agriculture-in-india/)
- Source: “PRS Legislative Research” [http://www.prsindia.org/parliamenttrack/vital-stats/status-of-water-availability-for-agriculture-in-india-4339/])
- Ibid, 5. Ibid, 6. Ibid, 7. Ibid
Appendix
| Table 1: PATTERN OF LAND USE AND IRRIGATION | ||||
| ( Area in million hectares) | ||||
| Year | Net Sown Area | Gross Sown Area | Net Irrigated Area | Gross Irrigated Area |
| 1 | 2 | 3 | 4 | 5 |
| 1990-91 | 143.00 | 185.74 | 48.02 | 63.20 |
| 1991-92 | 141.63 | 182.24 | 49.87 | 65.68 |
| 1992-93 | 142.72 | 185.70 | 50.29 | 66.76 |
| 1993-94 | 142.34 | 186.58 | 51.34 | 68.26 |
| 1994-95 | 142.96 | 188.05 | 53.00 | 70.65 |
| 1995-96 | 142.20 | 187.47 | 53.40 | 71.35 |
| 1996-97 | 142.93 | 189.50 | 55.11 | 76.03 |
| 1997-98 | 141.95 | 189.99 | 55.21 | 75.67 |
| 1998-99 | 142.75 | 191.65 | 57.44 | 78.67 |
| 1999-00 | 141.06 | 188.40 | 57.53 | 79.22 |
| 2000-01 | 141.34 | 185.34 | 55.20 | 76.19 |
| 2001-02 | 140.73 | 188.01 | 56.94 | 78.37 |
| 2002-03 | 131.94 | 173.89 | 53.90 | 73.06 |
| 2003-041 | 140.71 | 189.66 | 57.06 | 78.04 |
| 2004-05 | 140.64 | 191.10 | 59.23 | 81.08 |
| 2005-06 | 141.16 | 192.74 | 60.84 | 84.28 |
| 2006-07 | 139.82 | 192.38 | 62.74 | 86.75 |
| 2007-08 | 141.02 | 195.22 | 63.19 | 88.06 |
| 2008-09 | 141.90 | 195.33 | 63.64 | 88.90 |
| 2009-10 | 139.17 | 189.00 | 61.94 | 85.08 |
| 2010-11 | 141.56 | 197.56 | 63.66 | 88.93 |
| 2011-12 | 140.98 | 195.69 | 65.70 | 91.78 |
| 2012-13 | 139.94 | 194.14 | 66.27 | 92.25 |
| 2013-14 | 141.43 | 200.86 | 68.10 | 95.77 |
| 2014-152 | – | – | – | – |
| 2015-162 | – | – | – | – |
| Notes : | 1. Data of Net Sown Area, Gross Sown Area, Net Irrigated Area and Gross Irrigated Area for 2003-04 onwards are provisional. 2. Not Available. |
|||
| Source : | Ministry of Agriculture & Farmers Welfare, Government of India. | |||